Turn your SEO Data into actionable Reports
Ask any person in SEO what they use – you’re more than likely to get a laundry list of tools that work to tackle SEO from all angles. With an explosion of data produced by these tools, decision-making becomes much more complex with the data sitting in different places. You can easily get overwhelmed staring at graphs and dashboards without being able to make that data actionable.
“Data is the new oil”, you’ve probably heard this quote ad nauseam in the past couple of years. Heck, we even got the data to prove it:

But we don’t put crude oil in our cars... do we?
Refining Data
In this multipart blog series, we’ll take SEO data (Google Search Console, crawl data, etc.) on a journey from their source into useful and actionable reports to make informed decisions on what to do next. No fancy or expensive tools are needed, we’ll stick to simple tools we can use for free like Google Sheets and Google Data Studio. You won’t need an Engineering Degree to do this either. We’ll move our way up from simple data processing, throw Machine Learning algorithms in the mix, and bring different datasets together to cross-reference the data to extract true value.
As a final step, we’ll put our designer hat on, and format the reports by adding some color and design to make them shine. We want to see the twinkle in a client’s eyes, am I right?
Tools of the Trade: Google Sheets
The Spreadsheet... the good old rows and columns filled with numbers, borders, and colors... you probably love and hate it at the same time. As much as we live in a world where databases store gigabytes (even terabytes) of data that can be queried in milliseconds, with tons of tools out there visualizing those results, I strongly believe the best way to get a feel for your data and iterate on building your reports is by using a plain and simple spreadsheet as a sandbox... fancier tools come in at later stages.
Ready to dive in?
Let’s go!
Log into Google Search Console and select the search property of your choice, then go to the ‘Search results’ section. Pro tip: this might not apply to all use cases, but I prefer to work on Domain properties to suck in as much data as possible, then filter in the data processing and reporting stages afterwards if I’m interested in a particular subdomain.

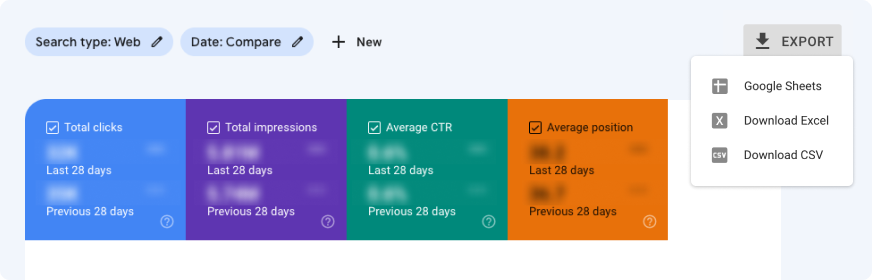
Now select a Date range from the ‘Compare’ tab, my personal preference is 28 days, but any date range works, just make sure you use the same date ranges consistently across the board going forward.

The more the merrier, so check all 4 key metrics: clicks, impressions, CTR and position. Then hit ‘Export’ and select ‘Google Sheets’.
Drilling down: Winners vs. Losers
The data is now ready in Google Sheets, separated in tabs, waiting for us to be processed. To understand which search queries have lost visibility and which queries attracted new eyeballs to our website, let’s create a fresh new tab, select the first cell ‘A1’, and enter this formula:
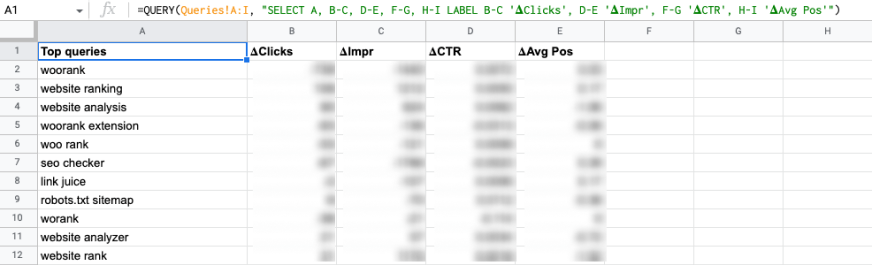
The QUERY formula allows us to select specific pieces from a larger dataset and execute simple aggregate functions on the resulting data at the same time. If you are familiar with the SQL query language, you’ll immediately recognise this syntax, here’s the breakdown:
- QUERY(Queries!A:I, “: perform the SELECT query on the ‘Queries’ tab (there is some ambiguity in the use of the term query here: the ‘Queries’ tab contains the search queries exported from Search Console, while the QUERY function is a native Google Sheet function)
- SELECT A, B-C, D-E, F-G, H-I: Select the search queries from column A, then select the (mathematical) difference between B and C, the number of clicks in the last 28 days minus the number of clicks in the previous 28 days; D and E, impressions; F and G, Click Through Rate; H and I, average position
- LABEL B-C '𝚫Clicks', D-E '𝚫Impr', F-G '𝚫CTR', H-I '𝚫Avg Pos'”): Optionally, label the selected columns with a descriptive name, eg. 𝚫Clicks for the difference (or ‘delta’) between B and C
This leaves us with a list of all search queries and their difference in metrics between the last time period and the previous period. That isn’t very actionable yet, so let’s figure out the top winners and losers for each metric.
Make it actionable
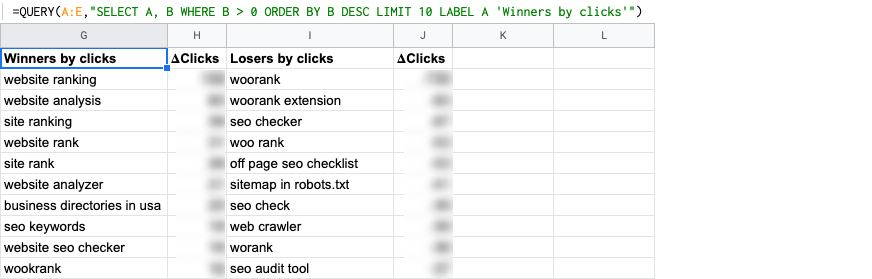
To get a better view of the actual winners and losers, we’ll select a Top 10 for each, per metric. Select an empty cell next to the existing data, let's pick G1, and enter:
Another query, this time with a few new directives:
- QUERY(A:E,: Query the data from the previous QUERY formula results
- "SELECT A, B: Select the search queries and the 𝚫Clicks columns
- WHERE B IS NOT NULL AND B > 0: Only take the non-empty (‘NOT NULL’) values, larger than 0, the ‘winners’
- ORDER BY B DESC: Sort them in descending order
- LIMIT 10: Take the first 10
- LABEL A 'Winners by clicks'": Label accordingly
A very similar query can be applied to cell I1, to find the losers. Only this time we need the values lower than 0 and sort the results in ascending order.
Summary
For the 1st part in this series, we’ll leave it here for now. This part has taught you how to export the entire Search Console dataset into a Google Sheet, and then process that data by executing QUERY formulas on them to extract meaningful Winners and Losers. There are a few more things you can do we’re leaving as an exercise to try on your own:
- Extract the winners and losers for other GSC metrics (Impressions, CTR and Avg. Position)
- Try listing search queries that are New (had clicks in the last period, but not in the previous period) and Dropped (no clicks in the last period, but had clicks in the previous period)
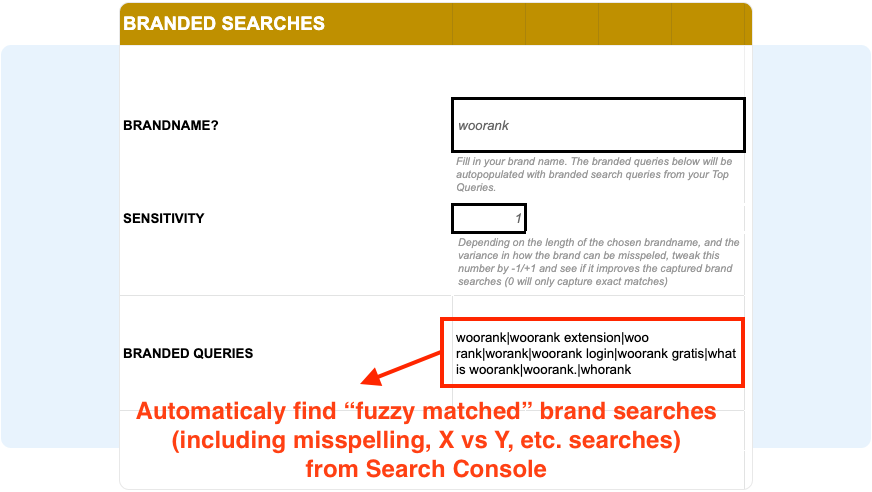
In the next part of this series, we’ll introduce Machine Learning algorithms to fuzzy match search queries with a brand name and extract all branded searches, including typos and misspellings. Make sure to subscribe to our newsletter to be notified when this article drops.