
A Guided Tour of Search Console
Google Search Console is a free tool from Google that provides website owners with a wealth of insights about how your pages perform in Google Search, from errors Google encountered while crawling your website, to the keywords users searched for triggering an impression or a click.
Features
Search Console has ton of features, including 2 relatively new ones:
- Manual action report added to the Overview page.
- The URL Inspection tool now runs on the live version of a page, instead of the version of the page in Google's index.
Google also has a sidebar navigation, making it easy to find, access and move between reports:
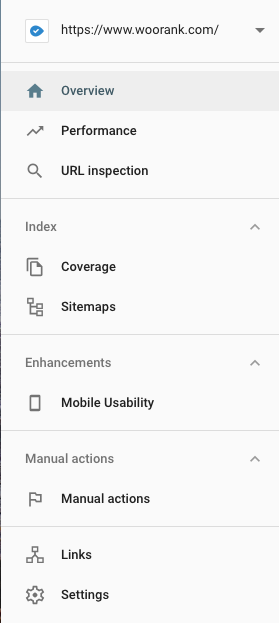
If you haven't seen or tried Google Search Console yet, there are some very useful features that help you to understand how Google sees your website. In this section, we'll dive into the different reports available to you and how to get the most out of all the data Google puts at your fingertips.
Performance
The Performance report allows you to filter data by metrics and groupings:
- Clicks
- Impressions
- Click-through rate
- Positions
- Devices
- Search appearance
- Countries
The data in Google Search Console goes back 16 months, allowing you to see how performance changed during this period.
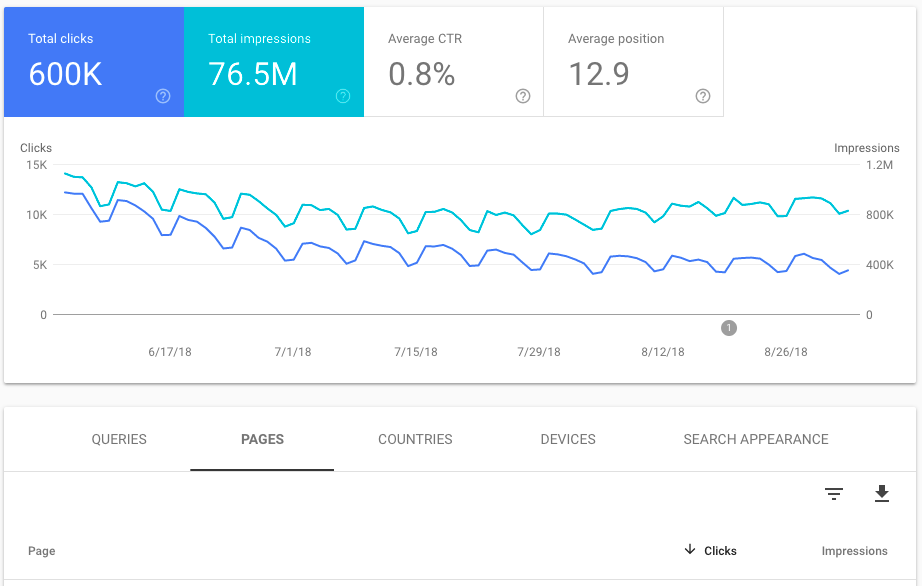
It's easy to slice and dice data or drill down to the page and query level, allowing you to uncover interesting trends and identify opportunities.
Using the Performance report
Using the Performance report is easy and quick. All your website's performance data is 4 (or less) steps away:
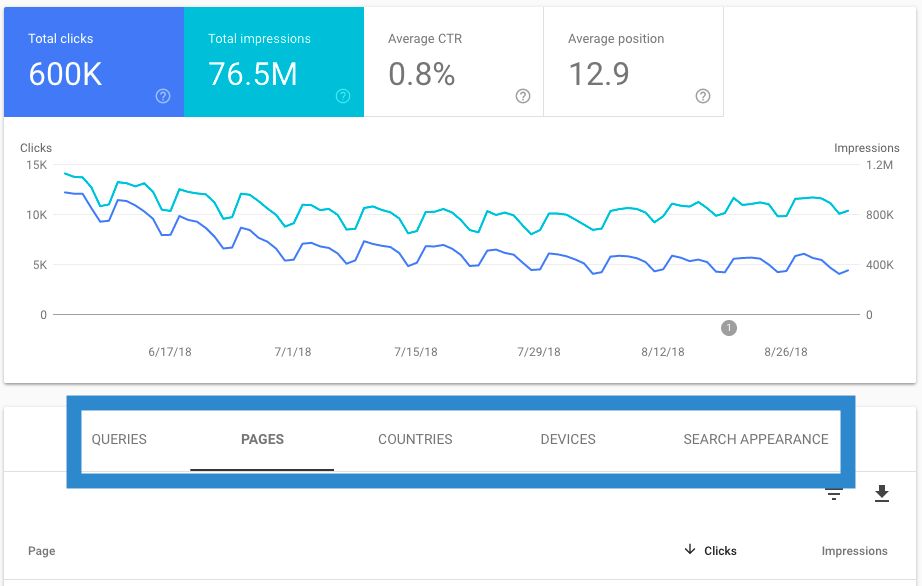
- Choose the metrics you want: Do you want to graph clicks, impressions, CTR, positions or some combination of the 4? Select which ones you want from the area above the graph:

- Choose how to group your metrics: Do you want to see clicks by query? Average positions of your pages? How many impressions do you get on mobile? Select one of the grouping tabs at the top of the table below the graph:
- Add a filter: You can filter your performance metrics by date or by any of the grouping options. You can filter by exact matches to see specific queries, or to include any data containing certain text, to see how your blog is performing over time. You can also add a filter by search type (this isn't available as a grouping in the table) to see performance in normal Google search results, image results or video results.
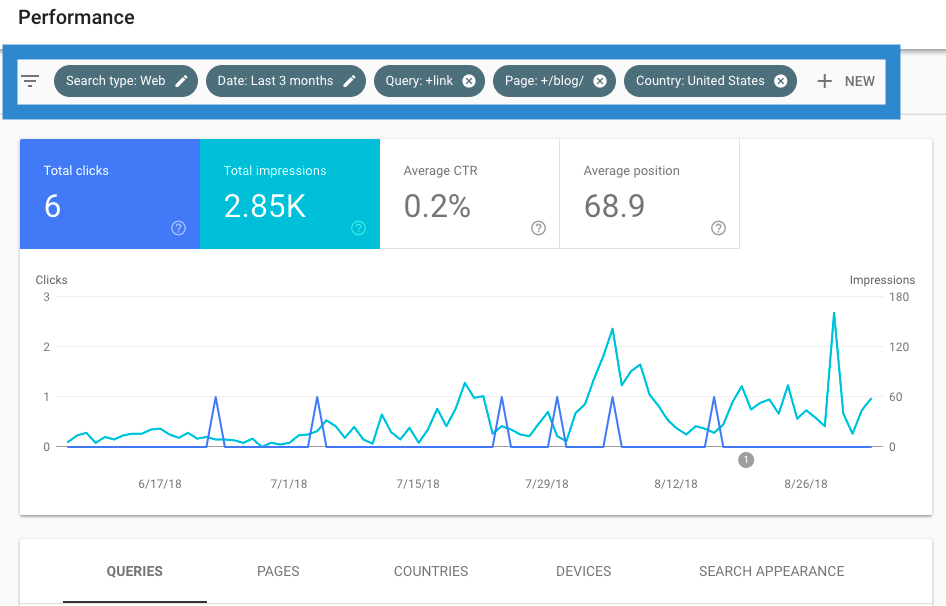
- Compare your data: You can compare metrics for any 2 exact values for the same grouping. So, for example, you can compare clicks from Spain to clicks from Canada, or positions for 2 queries or compare how all metrics have changed from one week to the next. When you compare data, one segment will show as the normal solid line while the other will be displayed as a dotted line.
What happened to my data on August 19?
Google changed the way it reported data for certain queries. Read our full explanation.
A seemingly small, but very still very important note about Performance data: unless you're looking at data grouped by page, all data is aggregated by site. This means that if your site appears in search results more than once, Google will only count metrics once for your site:
- Impressions: If 2 pages on your site rank for the same query, only a single impression will be recorded in Search Console.
- Clicks: If a user clicks on your site, goes back to the search results and clicks on your site again, Search Console will only report one click.
- Position: The position for the top ranking page will be recorded. So if you have different pages ranking first and third for a query, Search Console will report your site as first for that query.
- Click through rate: The way the report calculates CTR is different based on site-level information or page-level information. Since clicks and impressions are calculated on a site level, if your site has multiple pages appear in a search result and it receives a click its CTR will be 100% (one impression and one click). When looking at page-level data, the page that receives the click will have a 100% CTR, while the other pages will have a 0% CTR for that query. Here's a helpful example from Google of a 3-page SERP breaking it down:
Google Search ResultsMetrics Aggregated by SiteMetrics Aggregated by Page www.petstore.example.com/monkeys www.petstore.example.com/ponies www.petstore.example.com/unicorns Click-through rate: 100% All clicks for a site are combined Click-through rate: 33% 3 pages shown, 1/3 of clicks to each page www.petstore.example.com/monkeys www.petstore.example.com/ponies www.petstore.example.com/unicorns Average position: 1 Highest position from the site in the results Average position: 2 (1 + 2 + 3) / 3 = 2
Use Google Data Studio to enhance performance data
For more advanced analysis, there's a nice free way to get more out of the Performance report with Google Data Studio's Google Search Console Connector.
Data Studio includes a free template for Search Console data.
The Data Studio report gives users the ability to:
- Switch between Search Console properties
- Display the change in metrics for the selected time period
- See a table of a site's landing pages for a particular query
- See a table of top landing pages with their top-ranking query
Aleyda Solis provided a more detailed explanation of the Google Search Console Connector on her blog.
UPDATE: Google Discover data
Google Discover a feed that Google uses to deliver fresh and evergreen content to users according to their interests. Users can also customize their Discover feeds by manually following certain topics.
It's available on the Google mobile homepage.
Search Console used to not include data about website traffic that came from the Google Discovery feed. Now, however, the Performance report is broken out into "Search results" and "Discover" reports.
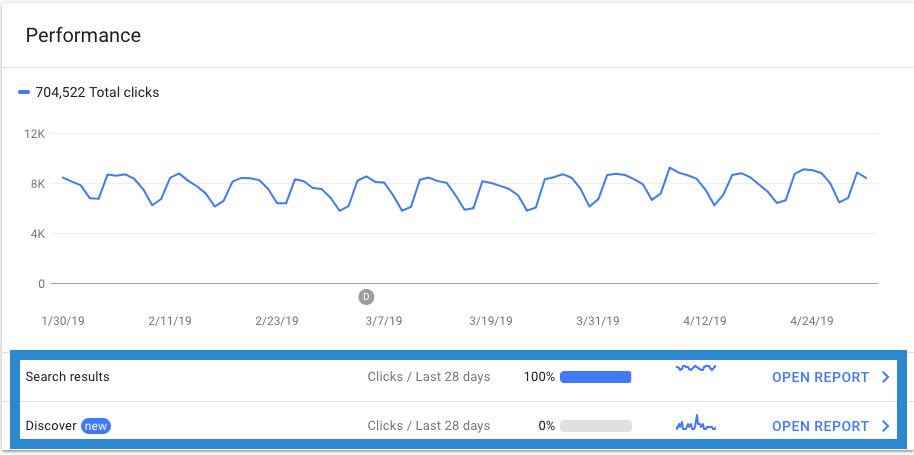
As you might guess, the "Search results" report is for data about regular Google search traffic and the "Discover" report contains only data about traffic from the Google Discover feed.
Since people find and access content slightly differently in Discover than search results, you'll see slightly different data in this report. Since people don't search for content in Discover, there's no information regarding queries or positions.
Instead, this report will show:
- Total clicks
- Total impressions
- Average click-through rate
Filters are limited to date and page.
The "Search results" report is the same as the "old" Performance report, so nothing has changed thre.
Note: As John Mueller confirmed on Twitter, the Disover report is completely new data that wasn't included in Search Console until now.
This was previously not shown in Search Console -- there's no query attached, so it wouldn't be possible to include it in the search performance report. New data for you :)
— 🌠John 🌠(@JohnMu) April 10, 2019
URL Inspection tool
The URL inspection tool gives you a detailed look at how Google sees a particular URL.
Inspection tells you:
- If the URL is in Google's index or not
- The reason why a URL isn't indexed
- The last time the URL was crawled
- How Google found your page
- Which sitemaps, if any, include the URL
- The canonical version of the URL
- If the URL is mobile friendly, and errors if it's not
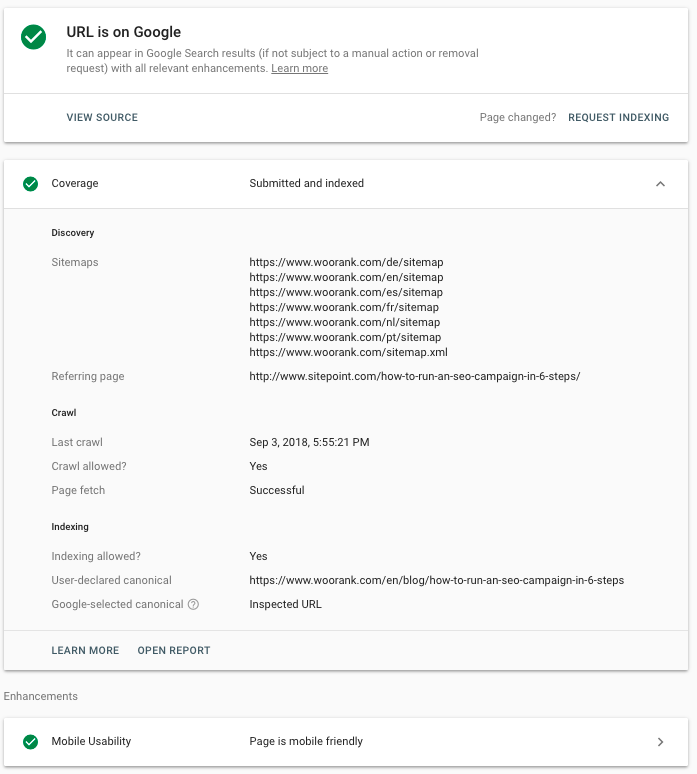
The tool will also list any enhancements, such as AMP or structured data, found on the page.
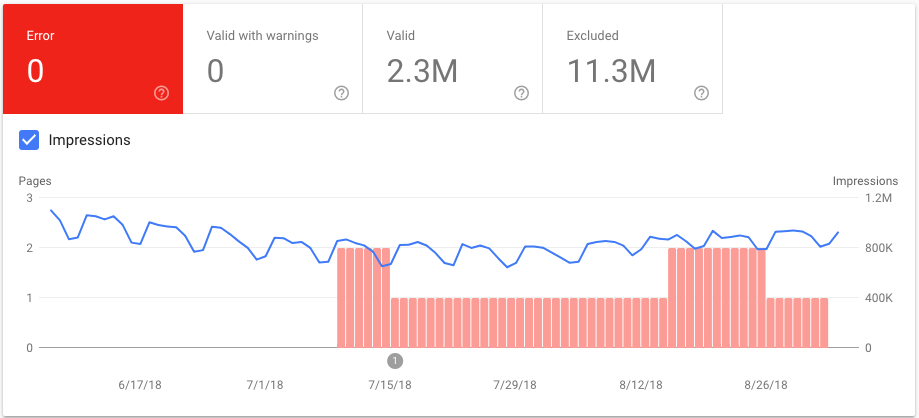
Index Coverage report
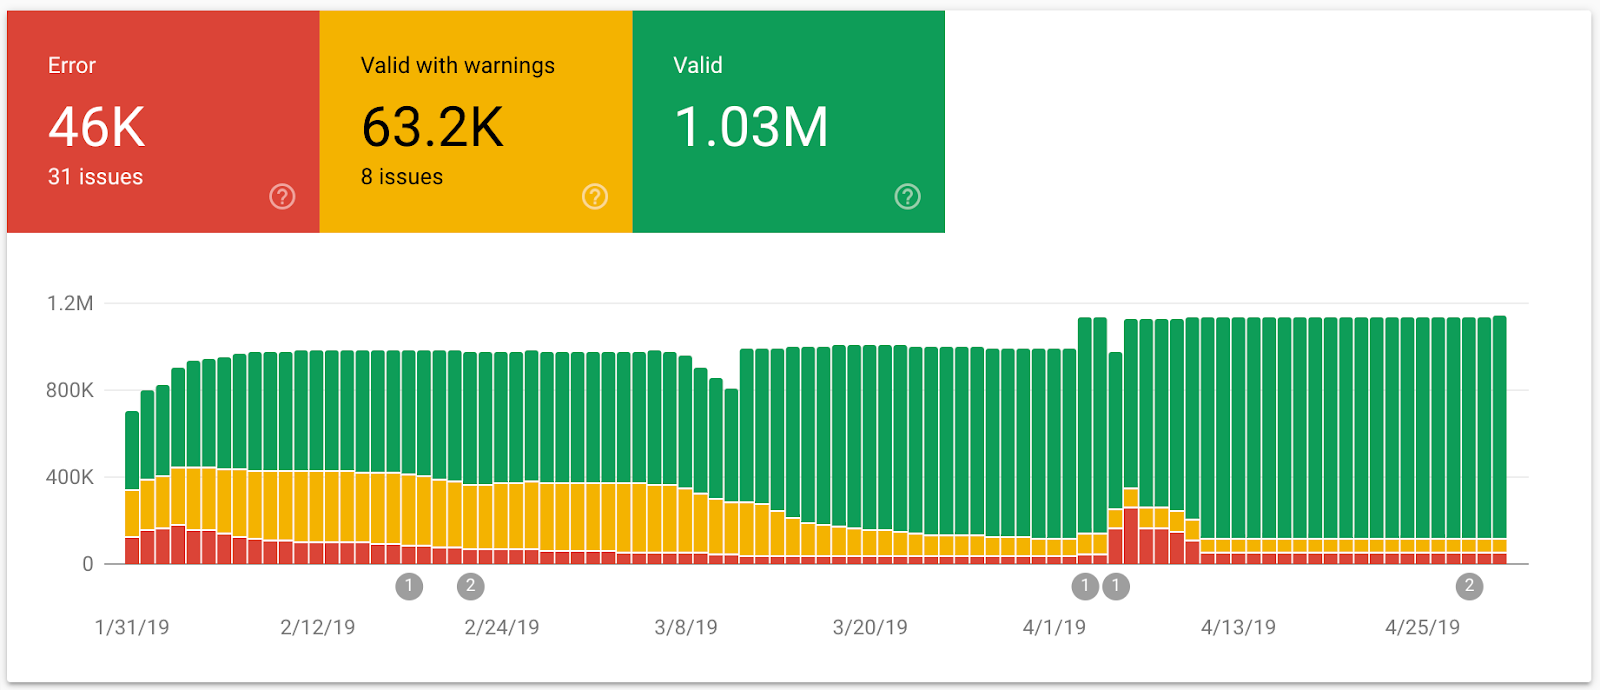
The index coverage report collects the data from the URL inspection tool into one report for your entire site. This report includes 4 types of page statuses:
- Errors: Pages that Google couldn't index due to an error, such as a 404
- Valid with warning: Pages that Google can index, but thinks that you probably don't want indexed, such as when you disallow a page via robots.txt, but Google finds it via an external link.
- Valid: Pages that appear in Google without any issues. All good.
- Excluded: Google decided not include these pages in their index for some reason other than an error. This could be because there's a canonical or a redirect pointing to another URL or, in the case of "crawled "” not indexed," some other reason they don't specify.
It plots this data over time. You also have the option to include your site's impressions (from the Performance report) to see if/how indexing is impacting your site's SEO performance.
You also have the ability to filter this report by all pages Google has found on your site, URLs you've submitted to Google or just the URLs found in your sitemaps.
The great thing about the Index Coverage report in Google Search Console is that it gives you the ability to inspect any URL not appearing in the index (using the URL inspection tool), test your robots.txt file to see if its disallowed there, and have Google fetch the page.
You can also ask Google to recrawl an unindexed page after you've fixed any errors to get it into Google's search results quickly.
Sitemaps
In Google Search Console, you can easily submit new sitemaps and/or check the status of any of your sitemaps.
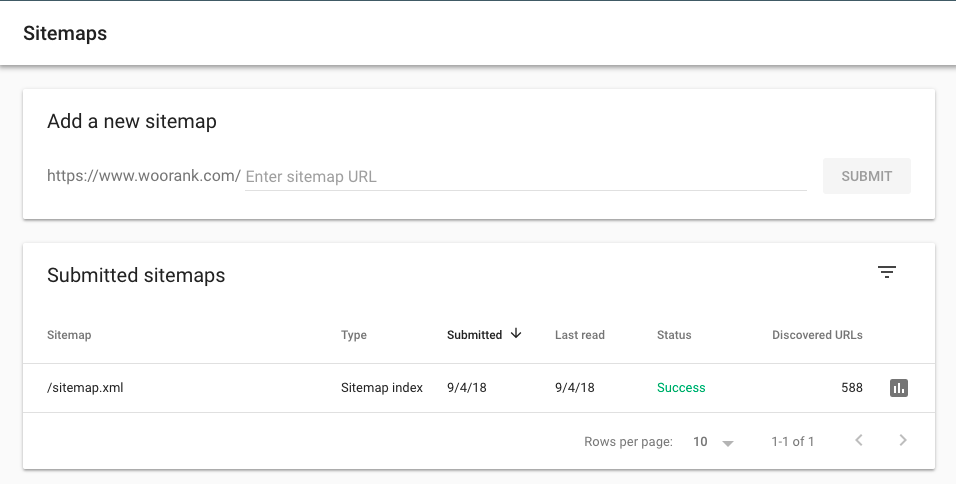
The "Status" column in the submitted sitemaps table will tell you if your sitemap was successfully processed or if any errors prevented Google from processing it.
- Success: This means exactly what you think it means: Google could load and process your sitemap without any issue.
- Has issues: Google could load your sitemap and possibly read and access some URLs, but some errors stopped it from fully processing the file.
- Couldn't be fetched: The sitemap couldn't be fetched at all so Google couldn't access it.
Click on a specific sitemap's row in the table to see what information Google has about it:
- When Google last read your sitemap
- How many URLs it found
- It's current status
You can access the sitemap's Index Coverage report by clicking the icon either in the submitted sitemaps table or the sitemap's details page.
Use the Index Coverage report to watch for spikes in indexing errors or drops in indexed pages. Check these errors to spot
- Errors introduced in a new (or existing) template, sitemaps including noindexed URLs or pages requiring a login.
- Errors in your robots.txt syntax that's causing Google to not index certain pages you want to appear in SERPs.

Enhancements Reports
The Enhancements reports track and show data regarding how your pages appear in Google search results.
Mobile usability
The Mobile Usability report tracks the number of pages on your site that are considered mobile friendly and the pages with usability issues for visitors using mobile devices. Like with the Index Coverage report, you can add impressions to the overview graph to compare mobile usability issues to SEO performance.
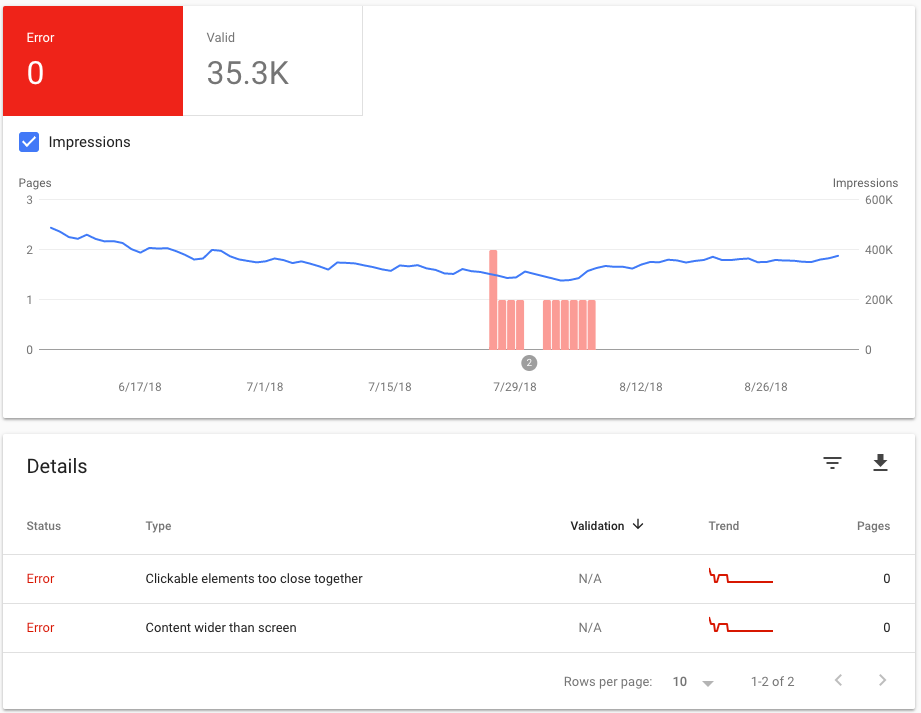
To see a sample of URLs with mobile usability errors identified by Google, click on the error type in the details table. This will list the URLs Google found that particular error on. Errors that impact mobile usability include:
- Flash usage: Using Flash to display content is generally a bad idea because many mobile browsers don't support it.
- Viewport not configured: The viewport meta tag scales a page to fit device screen (this is part of what's known as responsive design). Not adding a viewport, or not setting it correctly, can cause your pages to display incorrectly on mobile devices.
- Fixed-width viewport: This error is caused by setting a page's viewport to a fixed width, usually the fit a non-responsive page on a mobile device's screen. However, this will cause the page to display incorrectly on other screens.
- Content not sized to viewport: These pages use absolute values in CSS declarations or use images that don't scale with browser width.
- Small font size: As you can guess, these pages have text size that's too small to read on a mobile device.
- Touch elements too close together: Buttons or links are too close to other tappable elements to be easily clicked. Users trying to tap these links are likely to accidentally tap the wrong link or button. If you've ever encountered this, you'll know why it's terrible for mobile usability.
Once you've fixed an issue, you can use Search Console to tell Google to recrawl your pages to validate your fix. This can take a few days, but Google will email you updates on their progress
Structured data reporting
Google Search Console's Enhancements reports now allow website owners to track how their structured data appears in search results and monitor them for errors.
Google has added tracking for logos and sitelink searchboxes (when the ability to search within a website appears in the Google results).
These enhancement reports track errors Google encounters when trying to read and interpret the structured data on your pages.
Security and Manual Actions report
The Manual Actions report is where you receive notifications for any manual penalties your site receives.
Hopefully, you'll never receive a notification here.
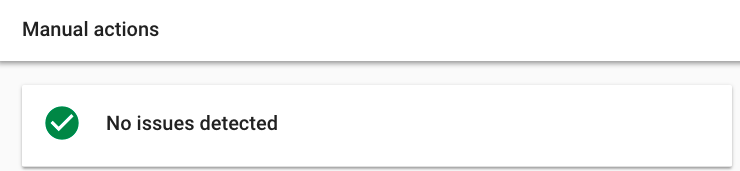
If you do get caught using tactics that violate Google's webmaster quality guidelines, the cause and scope of the penalty will be shown here.
Google manual actions can apply to individual pages, folders or subfolders or your entire website. Pages currently under a manual action will not appear in Google search results.
Fixing your manual action will depend entirely on what sort of issue you're being penalized for.
Links
The Links report tells you how many links your website has pointed to it, who they're from and what anchor text they use when linking to your site. It also includes an internal link report.
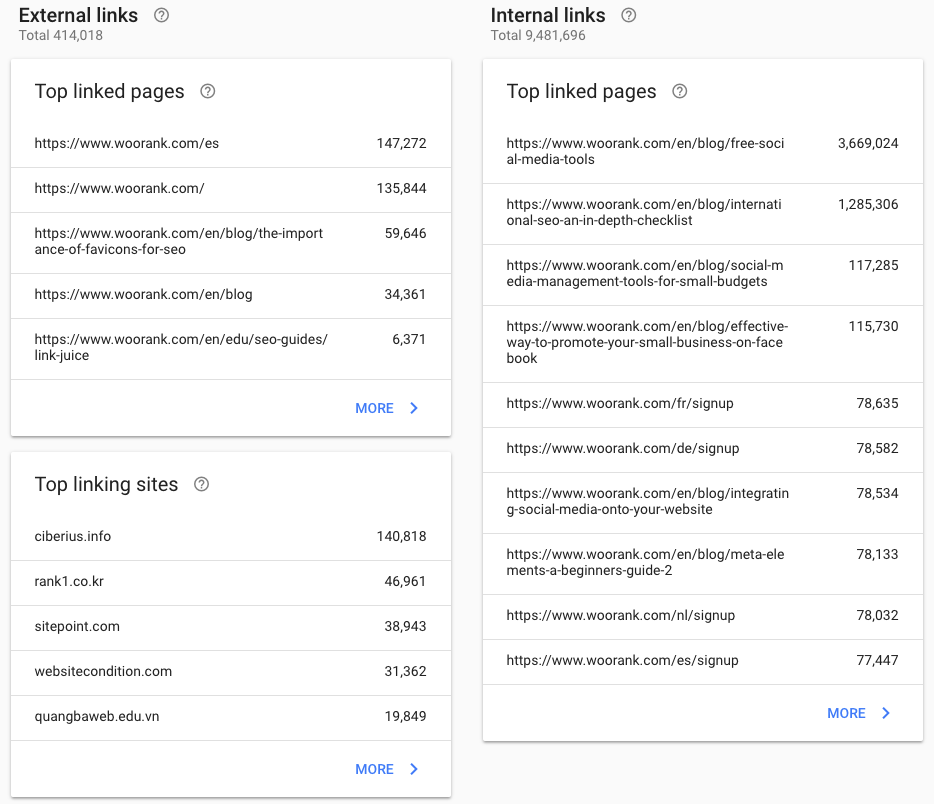
You can export the external links pointing to your pages. Exporting link data (clicking the export button in the upper right) will download up to 100,000 rows of data:
- Latest links: This option downloads the 100,000 most recently discovered links in Google's index. This data includes the URL linking to your page and the date the link was found by Google.
- More example links: This downloads a sample of 100,000 links pointing to your site, taken from all of the links Google knows about. This data is just the link page's URL.
You can click "More" for any of the link reports "” external links, internal links, top linking sites or top linking text "” and download the 1000 rows displayed in those reports.
The links report in Search Console will help you answer all sorts questions about your site's link profile and link building:
- Which content is getting the most links? This is pretty self-explanatory. Uncover which pages on your site are delivering the most link juice to your site.
- Which sites are linking to you the most? You can see the top root domains in the Top Linking Sites report, or you can click on a domain in that report and see all of the pages on your site that these sites are linking to. Uncover opportunities for potential future partnerships or relationships.
- What sort of anchor text is in your link profile? Over-optimized anchor text is one of the signs of a blackhat link scheme. Find potential spam links to disavow.
- What are the sites linking to a particular page? See what types of sites are interested in your content. If a page has good links pointing at it, create more content on the same topic.
- How are users and link juice flowing around my site? Look at how you're linking your pages together. Make your site easier to navigate to users and make your link juice more efficient by making sure pages are accessible in the fewest number of clicks.
Knowing where your links are currently coming from, and what content attracts a lot of links, is one of the most important pieces of information at the start of any link building campaign.
Want more links? Improve your Google rankings with link building.
More Coming
Google says they'll be adding new features, data and reports in the future. As they said, Search Console supports most use cases, but features are constantly being updated.


