

An In-Depth Guide to Measuring & Tracking Core Web Vitals
What are Core Web Vitals?
First of all, what do we mean when we talk about the Core Web Vitals (CWV)?
Core Web Vitals are a set of metrics centered around measuring the experience real-life people have when they try to access and use a page out on the web. These metrics are trying to quantify a page’s user experience by measuring how long someone has to wait for a page to load, respond to an interaction, and become visually stable.
These metrics are:

Largest Contentful Paint: The time it takes to display the largest content visible on a user’s screen. It tells us how long someone has to wait for a page to load the largest (and usually main) piece of content.

First Input Delay: The time it takes a page to start responding after a user interacts with that page for the first time (click a link, tap a button, play a video, etc.). It tells us how long a user has to wait until they can use a page.

Cumulative Layout Shift: How much the content on a page moves around as that page loads. It tells us how stable a page appears to be for someone waiting for it to load.
Google combines these metrics with other search signals to create what they call a “Page Experience” score. Along with the CWV metrics, Page Experience scores also look at:
- A page's mobile friendliness
- Safe browsing
- HTTPS and page security
- Intrusive Interstitials
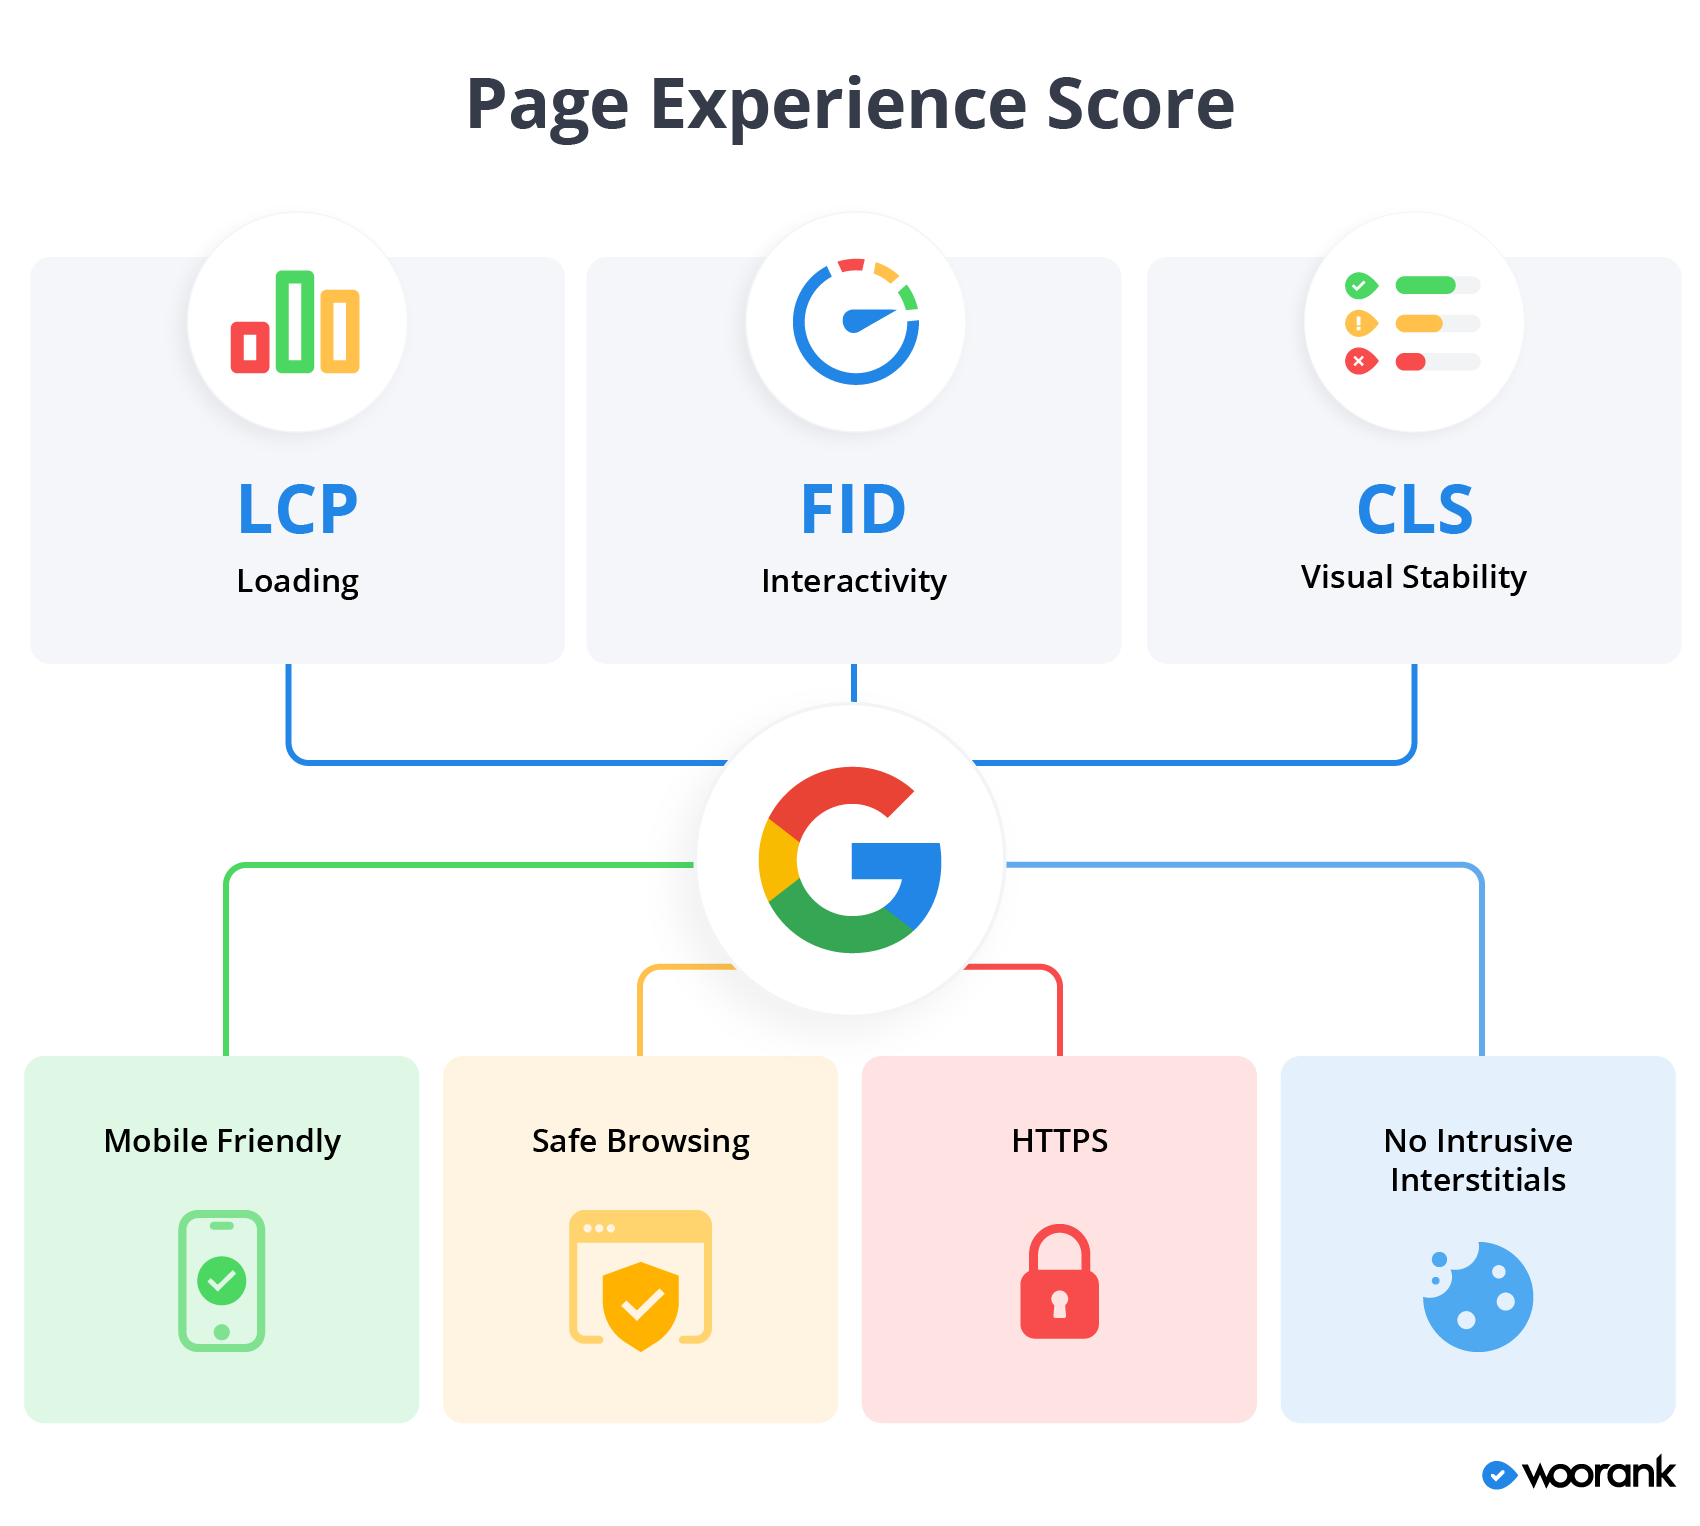
This Page Experience Score is a factor used when ranking pages in Google search results. Therefore, the CWV metrics are also important SEO factors.
Understanding Field vs. Lab Data
One of the key principles when it comes to measuring Core Web Vitals data is the concept of “lab data” and “field data”, along with their associated tool sets (“lab tools” vs. “field tools”).
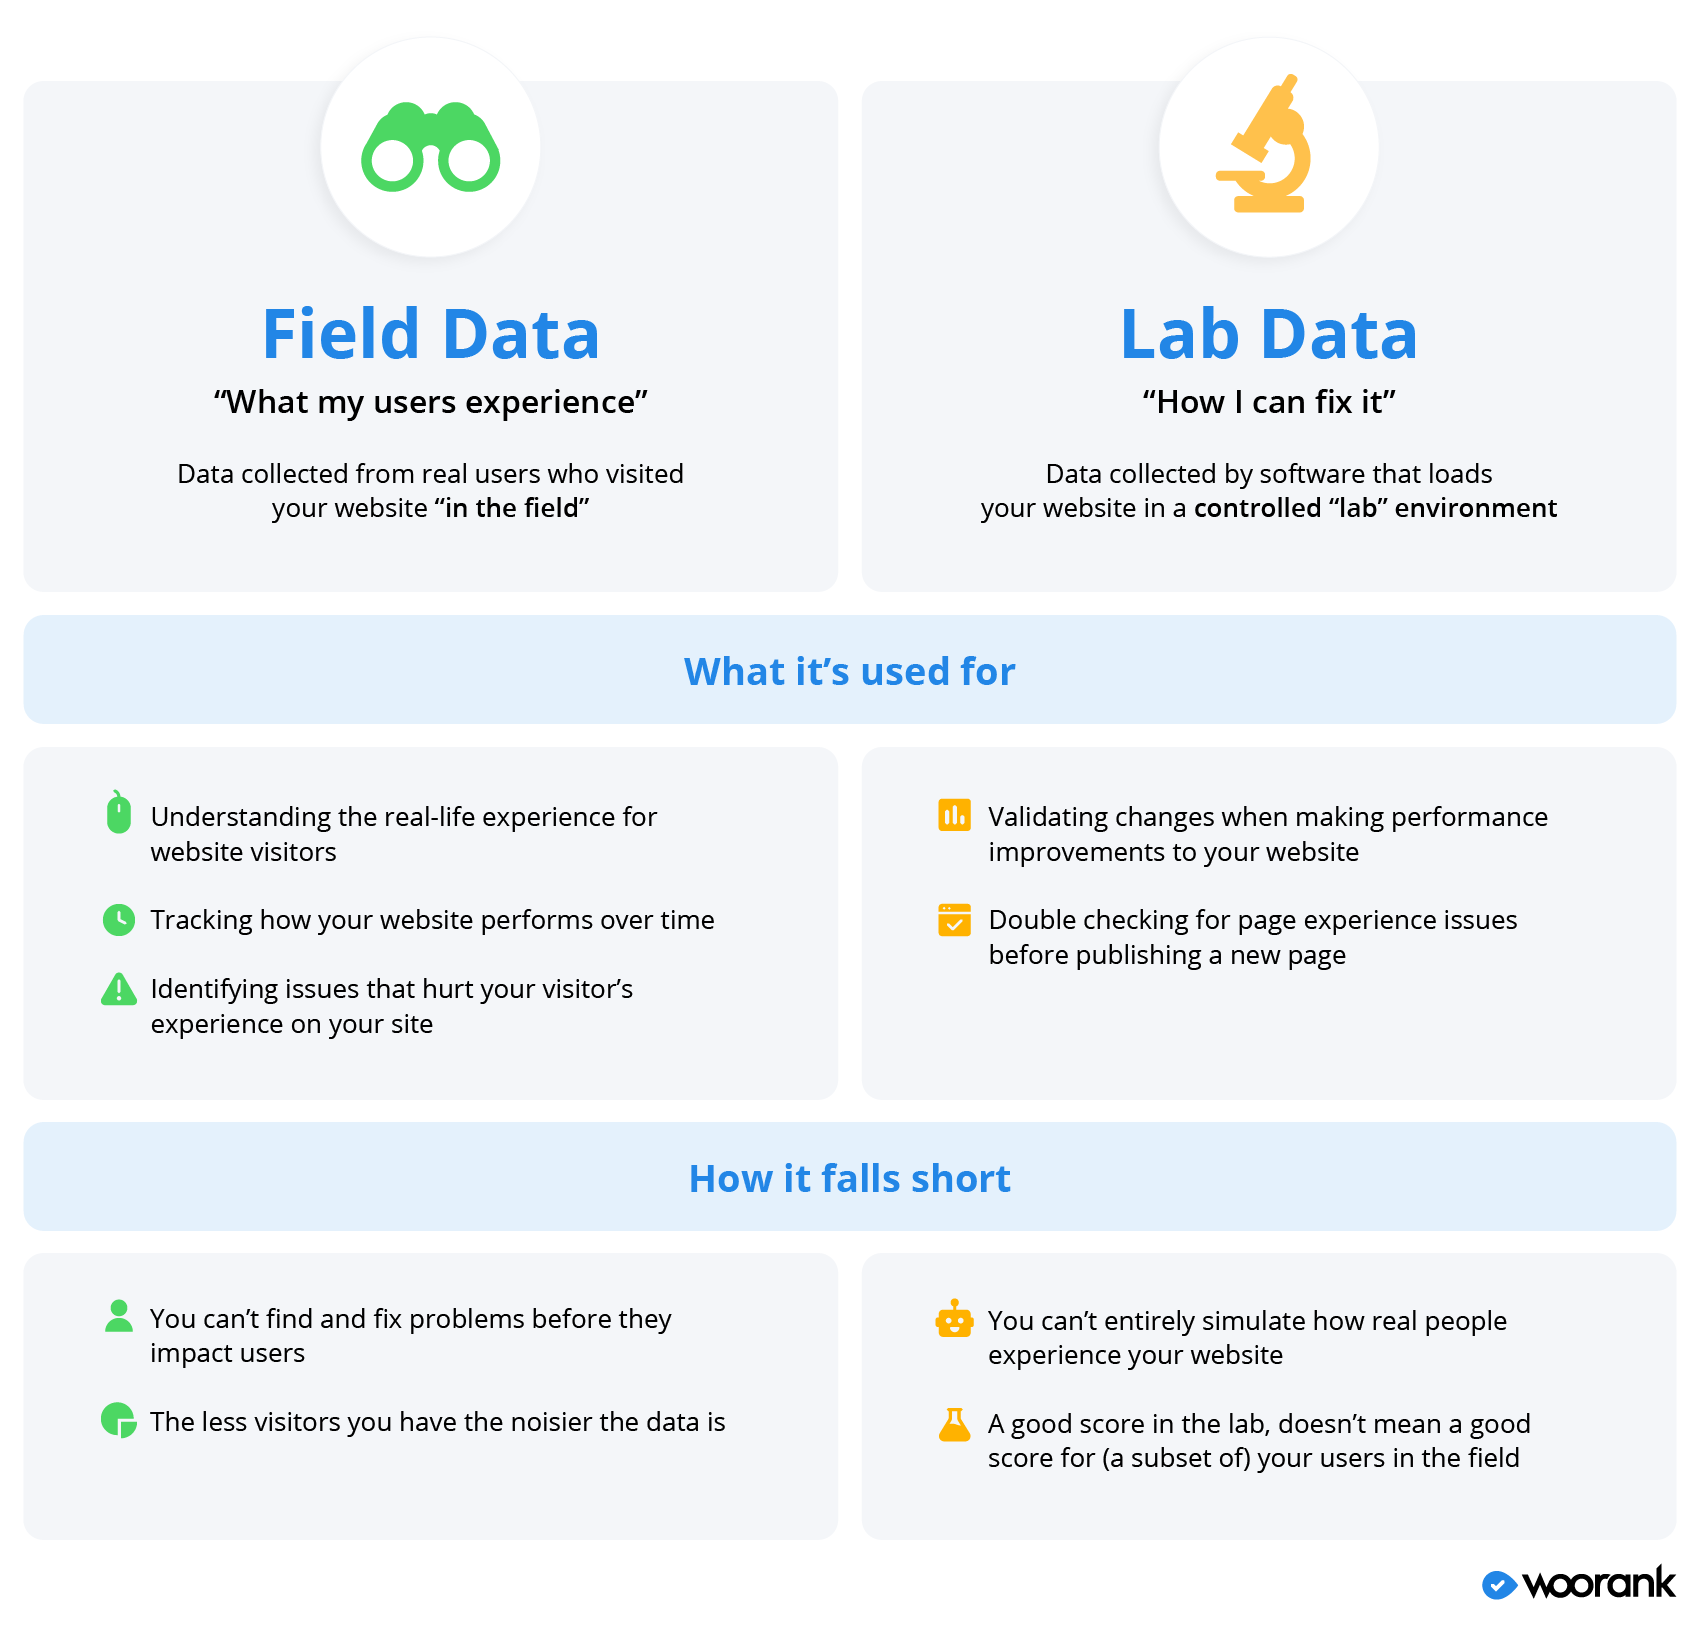
- Field data: Field data is collected by logging how a page performs when real-life people visit it. It’s also sometimes called “Real User Monitoring,” or RUM.
- Lab data: Lab data is collected by creating a simulated environment to load a page. Lab data controls for variables such as connection speed or device speed. This data is generated by using tools and software that use identical environments to generate reproducible results.
Understanding the difference between “lab” and “field” is incredibly important when measuring and analyzing your site’s CWV performance data because you can wind up with vastly different scores for each metric depending on which type of data you’re looking at.
This will lead to you likely miss performance issues impacting both your users and your site’s SEO.
So if lab tools use simulated site visits to collect and report data, that must mean they’re pretty useless when compared to field tools based on RUM, seeing as Google itself uses field data when scoring a site’s CWV, right?
Not really, no.
Both types of data are important for website owners and you need both lab and field tools to really make sure your website scoring well with users and Google.
Field data will give you a more accurate picture for how people experience your website, but it’s not as useful when it comes time to improve your site’s CWV scores. Lab tools, on the other hand, can make suggestions to fix performance issues.
In other words...
Field tools tell you what’s happening and lab tools tell you how to improve it
If you’re a website owner or marketer, you’ll probably mostly rely on field data. If you’re a developer, you’re more likely to use lab tools.
Google's CWV Tools
Google has released multiple free tools to help people monitor their website’s page experience and CWV score, both field and lab.
Google’s Lab Tools
Google has three lab tools that can perform a CWV analysis for your pages.
The first is Google’s Lighthouse tool. Lighthouse is an auditing tool that checks a site for performance, accessibility and SEO issues along with scores for the Core Web Vitals metrics.
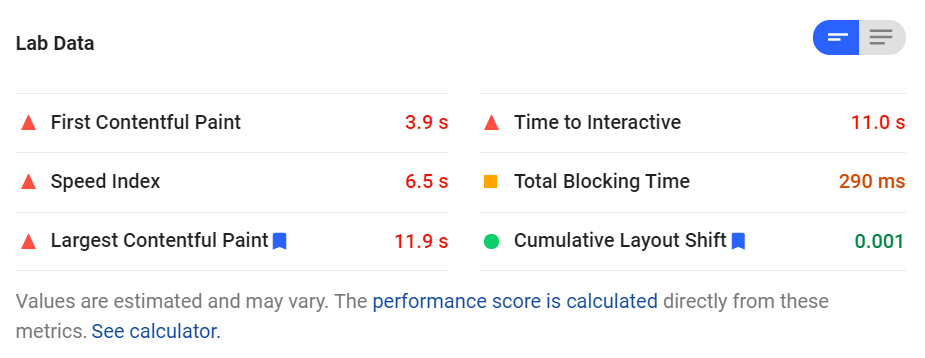
The PageSpeed Insights tool is a similar auditing tool from Google that analyzes and scores pages according to criteria focused on performance and user experience.
The PageSpeed Insights score is based partially on how a page performs according to the Largest Contentful Paint and Cumulative Layout shift metrics.
Another way of checking your site’s performance for CWV metrics is through Google’s Chrome DevTools. These tools are, as you can probably tell, tools designed for developers and provide all sorts of in-depth technical details for a page’s performance.
You can use DevTools to check for unexpected layout shifts impacting CLS in DevTool’s Performance panel.

Note about First Input Delay and Lab Tools
If you decide to check out any of Google’s lab tools to measure your site’s Core Web Vitals data, you’ll probably quickly notice one glaring omission: First Input Delay. That’s because FID is, by necessity, a field-only metric.
As we noted above, FID measures the amount of time it takes for a site’s server to respond the first time a person tries to interact with certain elements on the page. So this metric requires an actual user to attempt an interaction.
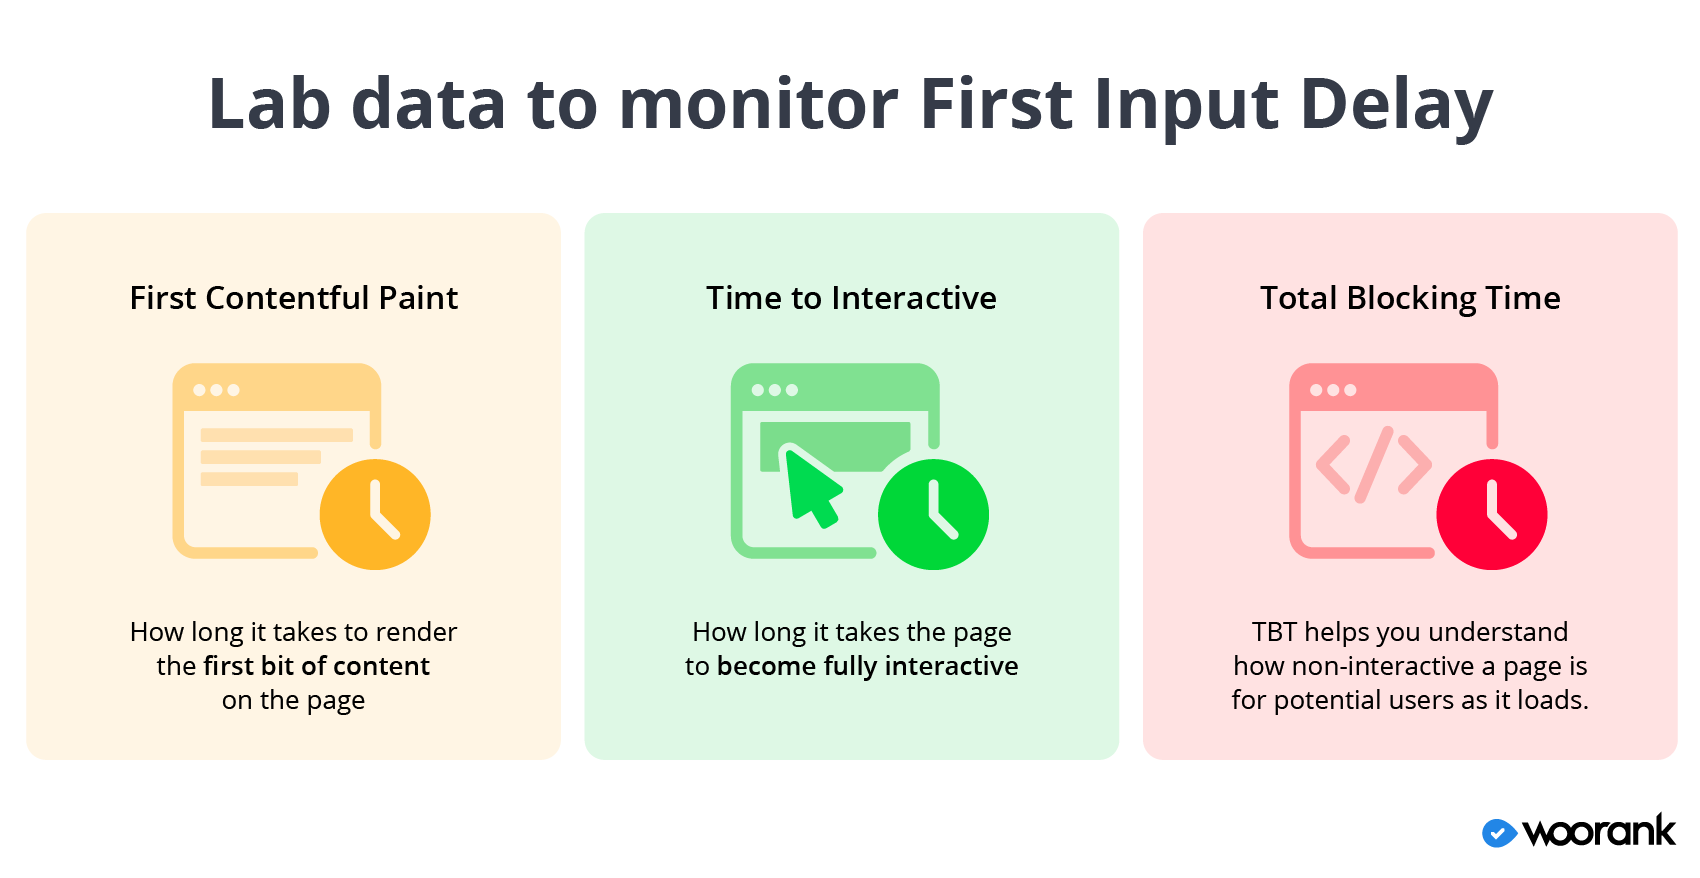
However, you can still use certain lab metrics to get a rough idea of how a page performs for First Input Delay:
- First Contentful Paint (FCP): FCP is the amount of time it takes a browser to render the first piece of content when loading a page. It tells us how long a potential user might have to wait before they can start consuming page content.
- Time to Interactive (TTI): TTI is how long it takes a page to become fully interactive, which requires that meaningful content be displayed, event handlers registered for visible elements and the page responds to interactions within 50 milliseconds. It tells us how long a potential user has to wait before they can start fully using a page.
- Total Blocking Time (TBT): TBT is the time elapsed between FCP and TTI. This metric tells you if there are any browser tasks that take longer than 50 milliseconds to complete and “block” the rest of the page from loading. TBT helps you understand how non-interactive a page is for potential users as it loads.
While these three metrics don’t really say how long users have to wait between clicking a button and the page responding, they do give us an idea of how long it takes a page to become responsive in general and what files, scripts and other tasks are keeping the page from responding to a potential user.
Google’s Field Tools
Chrome User Experience Reports
Google’s Chrome UX Report, or CrUX for short, is a publicly available database containing data recorded when real-life users visit a page on the web.
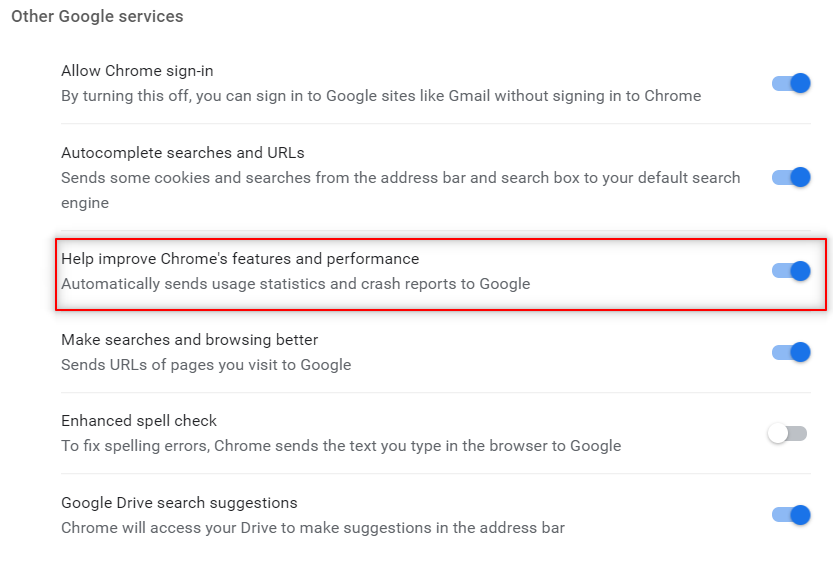
CrUX data is collected when someone using Google’s Chrome browser opts into syncing browser data across devices and don’t have a sync password set up. Users also have to have usage statistic reporting enabled (this is what Google is doing when it asks if you want to automatically send usage and crash reports to Google).
You can access CrUX data for your website via:
- The PageSpeed Insights tool, which analyzes CWV performance for a specific page.
- Google’s BigQuery project, a Google cloud computing and data storage service.
- A feature in Google Data Studio known as “community connector” that automatically creates a dashboard from CrUX data.
Chrome User Experience Reports
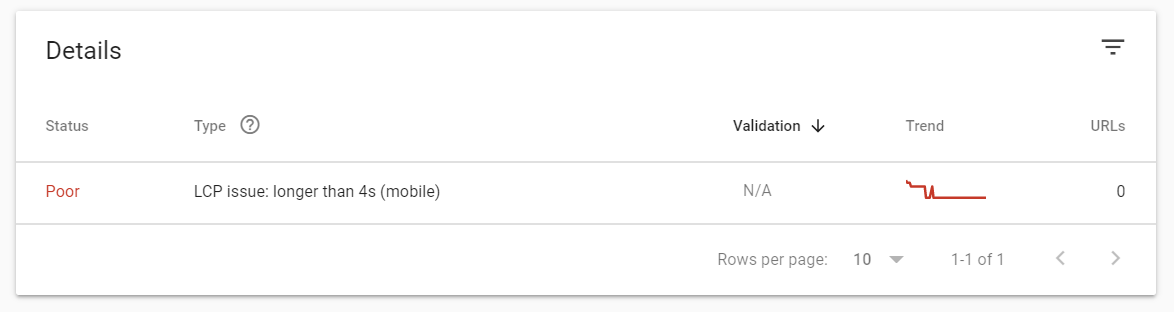
The easiest and simplest of Google’s field tools, Google Search Console added the Core Web Vitals report in May 2020.
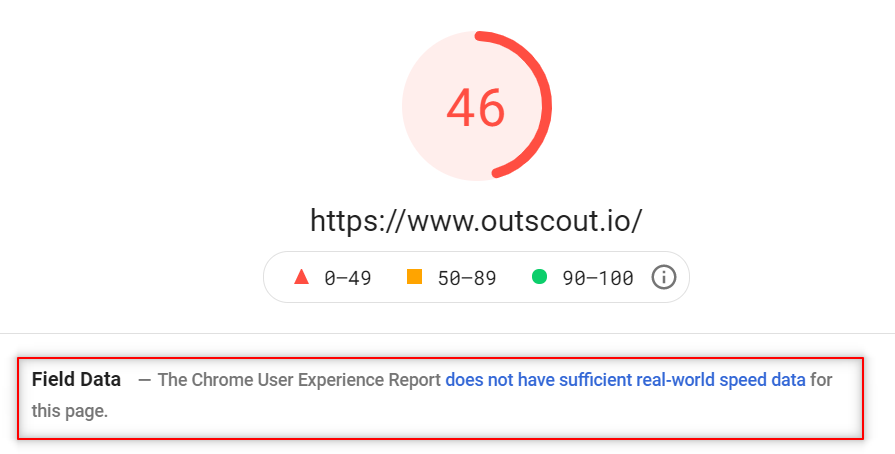
You can also access your website’s field data through PageSpeed Insights, which we discussed above as a lab tool.
If you analyze a URL with the PageSpeed Insights tool and Google has CrUX data for that URL, it’ll show a section with a Core Web Vitals analysis for the analyzed page.

It’s worth noting here that while Google Search Console and PageSpeed Insights are their own separate tools, they rely on CrUX data to perform their CWV analysis for a page.
Limitations to Google’s field tools
All things considered, Google’s CWV field data are generally pretty useful. But they are limited in ways that you may not realize.
The biggest limitation to Google’s field tools is that they rely on CrUX data, which isn’t all-encompassing.
Google’s CrUX database covers millions of websites, which sounds like an impressive number. However, there are 2 billion websites in existence and right around 400 million of them considered “active”. There is a chance your domain isn’t included in Chrome User Experience reports which means Google doesn’t have any field data for your users.
Without CrUX data, Google can’t provide accurate field data for your site.
A second problem with Google’s CWV field tools is that they have a 28-day reporting threshold. Meaning they look at data for page visits from the last 28 days when scoring a page’s performance (we expand on this below).
This is a problem for sites and pages younger than 28 days or who haven’t received enough visitors over the past 28 days for Google to analyze. Google tries to get around this issue by looking at “similar” pages and scoring newer pages based on the data for those “similar” pages. But this data isn’t collected from people visiting the actual page.
So despite being billed as field data you’re actually getting something slightly different.
The third issue with Google’s field tools is that they require at least some level of technical know-how when it comes to accessing the tools and getting data into a usable format.
- Lighthouse and Chrome DevTools require you to know who to access these tools through the Chrome web browser, which is not something a non-developer would generally know.
- Chrome User Experience reports need you to know how to query the CrUX database (which require you to know SQL) and then build a dashboard to display and analyze tech data.
And even for advanced users who do know how to access Lighthouse or use the CrUX database, that still requires multiple extra steps and third-party tools to actually use the data.

Monitor and Track CWV with WooRank Projects
WooRank’s mission is to make it quick, easy and straightforward for anyone looking to improve their website and marketing. We’ve taken that approach to measuring Core Web Vitals data.
To that end, we’re turning our website Reviews into Core Web Vitals lab tools perfect for testing and debugging Poor CWV scores.
Within the Usability section for a page’s review, you’ll find which page elements are causing problems for the CWV metrics, making it easy for you or your dev team to fix the problems and improve performance.
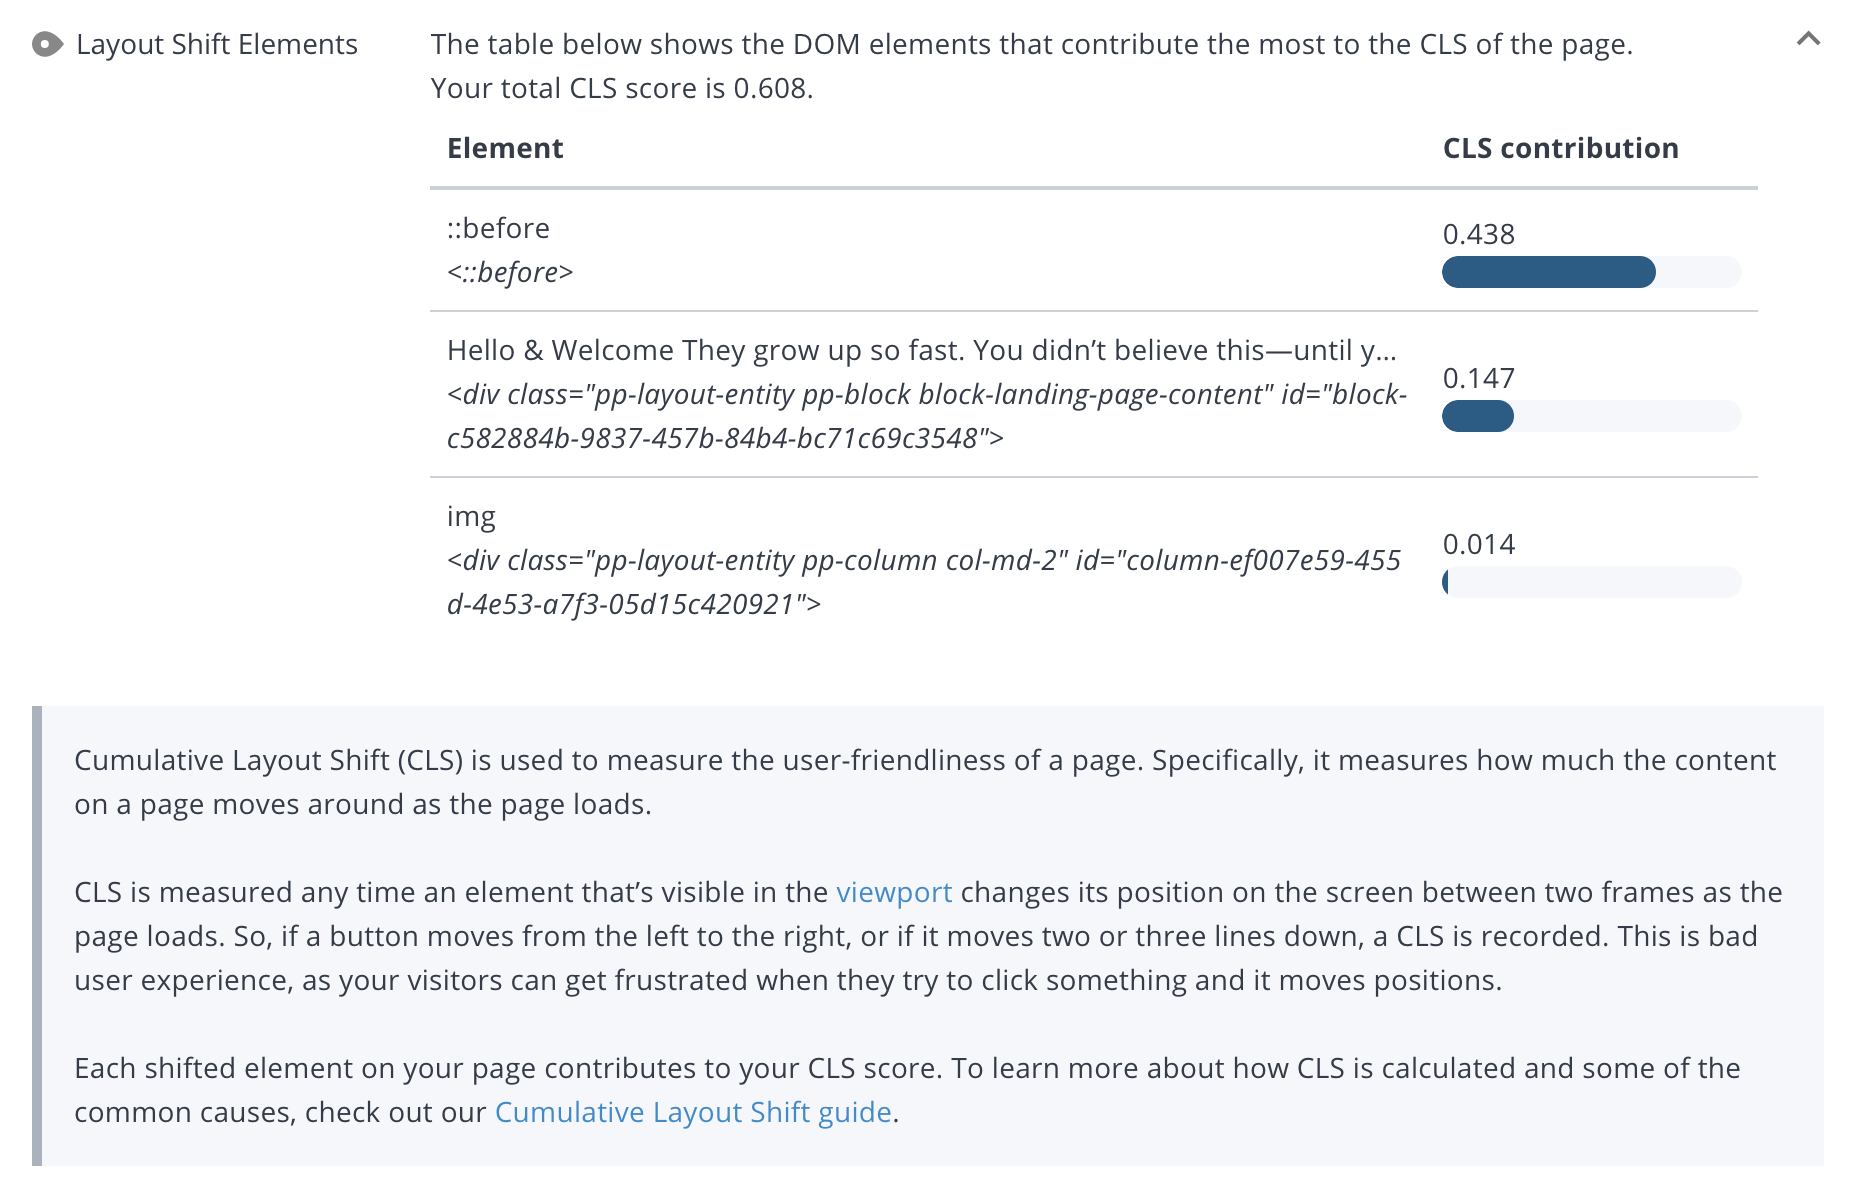
See the Review in action, debugging a page’s poor Cumulative Layout Shift score:
WooRank customers also have access to the new Assistant feature.
The Assistant’s main function is to analyze and show a page’s data right on the page. And we’re able to include CWV field data in the Assistant.
The best part is that the Assistant doesn’t have the limitations of Google’s CrUX data; you don’t need to worry about whether or not your site has been included in the CrUX database or if your pages have 28 days’ worth of data.
WooRank’s Assistant will start collecting, analyzing and scoring field data as soon as the page starts receiving traffic.
A Detailed Look at Google’s Core Web Vitals Scoring Methodology
How are the Core Web Vitals scored?
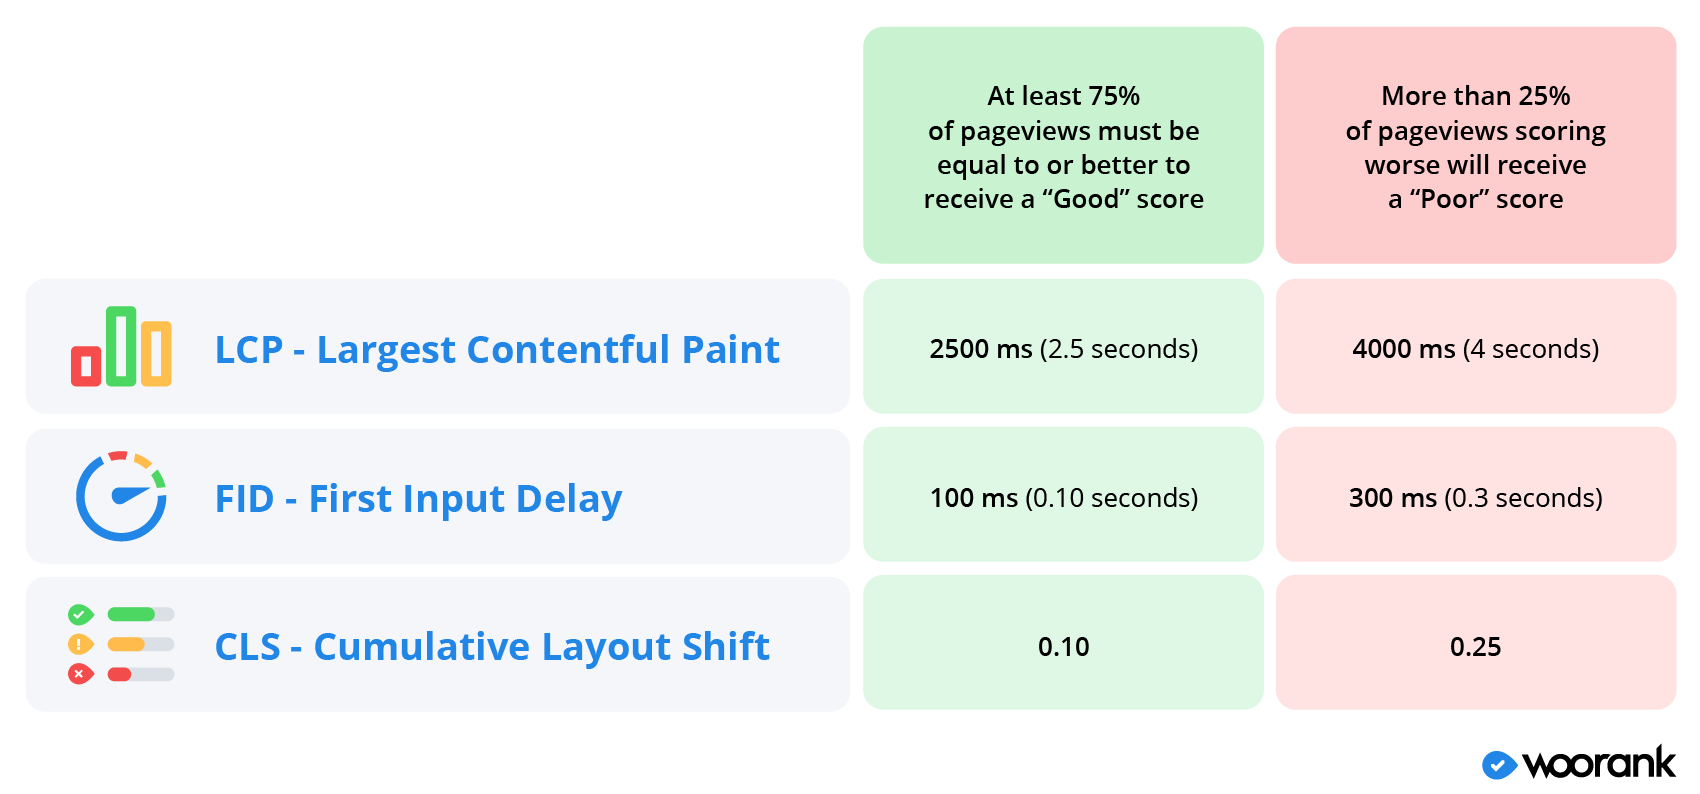
Google scores the Core Web Vitals - Largest Contentful Paint, First Input Delay and Cumulative Layout Shift - on a spectrum of “Good” to “Poor” with metrics that fall between those two are given a “Needs Improvement” score.
Each CWV metric has its own scoring thresholds:

- Largest Contentful Paint: An LCP less than 2.5 seconds is considered “Good” and anything longer than 4 seconds receives a “Poor” score.

- First Input Delay: An FID less than 100 milliseconds receives a “Good” score while a delay longer than 300 milliseconds is “Poor”.
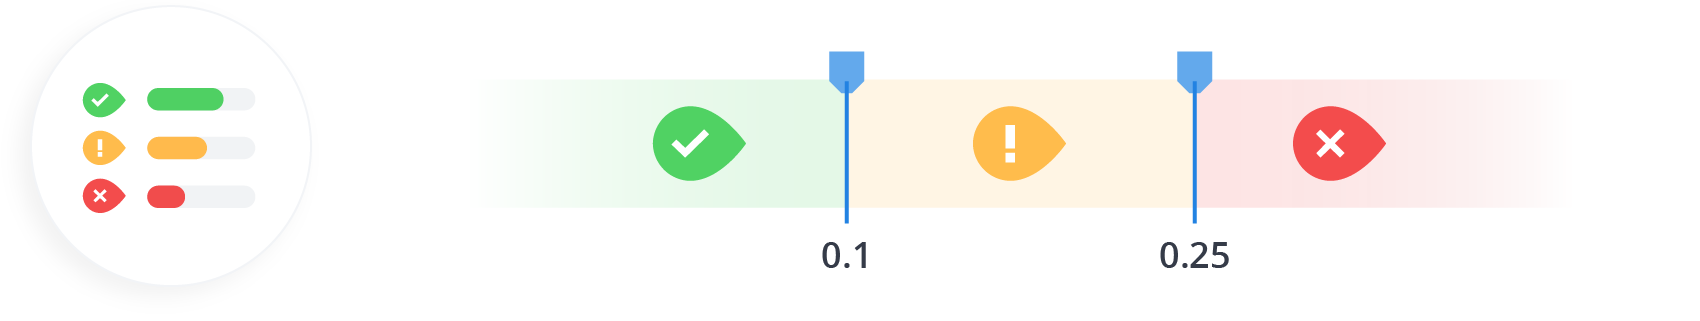
- Cumulative Layout Shift: A page with a total CLS score of 0.1 or less is “Good” while a CLS more than 0.25 is “Poor”.
How does Google measure CWV metrics for scoring?
To measure the Core Web Vitals metrics, Google evaluates pages based on the previous 28 days’ worth of page visits.
For example, if you have a page on your site that gets 100 visitors each day in the month of April and Google looks at the page on the first day of May, it will score the CWV metrics based on the page’s performance for the 2800 people who visited from April 2-30.

Any page visits that fall outside that 28-day window won’t have an impact on LCP, FID or CLS scores or the page’s overall Core Web Vitals score.
The actual scoring of “Good,” “Needs Improvement” and “Poor” depends on the 75th percentile of all page views that occurred within that 28 day window.
In other words, if 75% of a page’s views in the last 28 days score within the “Good” range for a particular metric, the page gets a “Good” score for that metric. On the other side of that, if 25% or more of a page’s views score below the “Poor” tipping point, that page will be classified as having a “Poor” score for that metric.
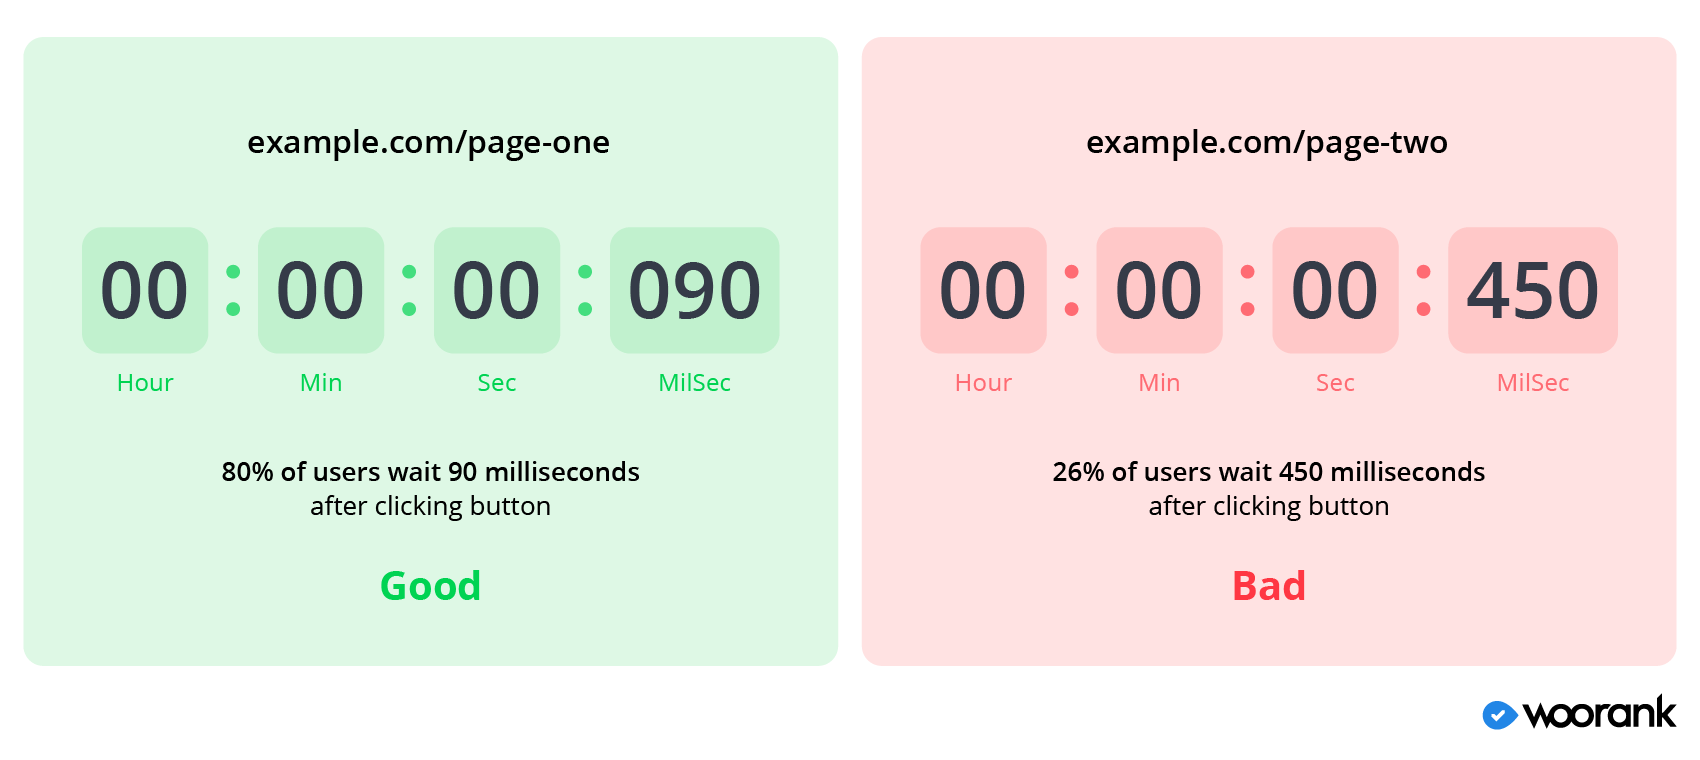
For example, the page example.com/page-one has an FID of 90 milliseconds or better for 80% of page visits in the last 28 days. That page is classified by Google as having a “Good” score for First Input Delay.
Conversely, the page example.com/page-two has an FID of 450 milliseconds for 26% of pageviews in the last 28 days. Google classifies that page as scoring “Poor” for First Input Delay.
Google outlines its reasoning behind the CWV scoring system in a blog post on the science behind CWV but the takeaway is that there isn't a certain number of layout shifts or a set amount of time a person will wait for before abandoning a page. Rather, it varies depending on the user and context.
This is how we wound up with the scoring spectrum of “Good” to “Poor” based on 75% of recent pageviews.
Measuring Data is Critical to Improving Core Web Vitals Scores
There’s a lot of nitty gritty details that go into how you measure Core Web Vitals data and use it to improve your website’s Page Experience for user experience and SEO purposes. One of the quick ways is to install WooRank's new on-page Assistant, but the key takeaways are:
- Understand the difference between field and lab data and that Google scores pages based on field data from real-life users.
- Google has field tools available for users, but the data is more limited than you might guess and the tools require a certain level of technical knowledge to use.
- WooRank is a fast, simple and easy way to audit your website’s performance for Core Web Vitals metrics for total beginners and advanced users.
Published by


